 MikeMighty (PRO)
that the rich are taxed enough because there money is over they can buy anything on this world they can travel around the world they can do any business like malls,like groceries,like casinos,like restaurants and more they can afford to pay many taxes they have a mansion,expensive cars and more and many money at bank accounts others have helicopter they can do what they want for him/her self others have a collections others are addicted in anything like smoking,alchoholic,gambling,prostitutions,drugs and others they can build anything like bars houses farms and more they can do all they want.
Return To Top | Posted:
 JohnMaynardKeynes (CON)
Framework
When we consider whether the rich are taxed enough, we must ask: what do we mean by “rich?” Rich means, according to Merriam Webster, “having abundant possessions and especially material wealth” (1). But there is no universal conception of this. A report from UBS showed that 4 out of 10 Americans with assets over $5 million or more do not think of themselves as rich (2). The report argued that “[t]he idea that you’re rich, then, seems to have a lot to do with what kinds of things you’d like to do, rather than hitting some specific asset or income number" (2). Another survey by the Spectrem Group also had conflicting results: "Of the respondents, 45% said $5 million or more, 25% said $25 million or more, and 8% said $100 million” (3). Several studies seem to indicate that people view those with double their level of income to be rich (3), and a study by Skandia International found that these conceptions of what constitutes being “wealthy” also deviate significantly by country (4).
Thus, we should define “rich” with with generalized criteria. We can do this by appealing to the law of diminishing returns, or the notion that marginal returns to some factor will eventually decline (5), defining it as “someone who has reached the point of diminishing returns to income”—or, in other words, the person has reached their peak happiness in terms of income.
Also, you should read this resolution as a normative question—as it only implicitly addresses a policy question. It poses an “is” statement, rather than an “ought,” and the transition is causal at best. Therefore, we have a normative resolution and a dual burden of proof. Second, you should weigh economic arguments higher than moral arguments. Whereas moral arguments cannot be factually or functionally evaluated, empirical economic arguments can be. For instance, you should weigh the argument that “the rich will only be taxed enough when X condition is met because of Y” more heavily than “it would be unjust to tax the rich more because of Y.”
Finally, our resolution is not country-specific, but it is imperative that both of us provide examples from specific countries in order to frame our arguments to attempt to glean an image of the rich as an aggregate. For instance, there may be counterexamples for both sides because countries are structured differently, but we should look to assess our cases based on a preponderance of evidence.
Arguments
Contention One: Secular stagnation persists.
Secular stagnation is the notion that structural shifts have ushered in an era of lower trend real GDP growth as a “new normal” (6)--or, in other words, we'll be stuck with around 2 to 2.5 percent real GDP growth instead of the long-run average of 3 percent. Demographic factors have reduced the natural rate of interest--or the interest rate consistent with equating savings and investment at full employment--and led to an era of a persistent demand shortfall, barring structural reform. The optimal solution to this is not only fiscal stimulus funded by higher taxes on the affluent, but a permanent fiscal expansion. I'll first lay out and prove stagnation, and then explain this proposal.
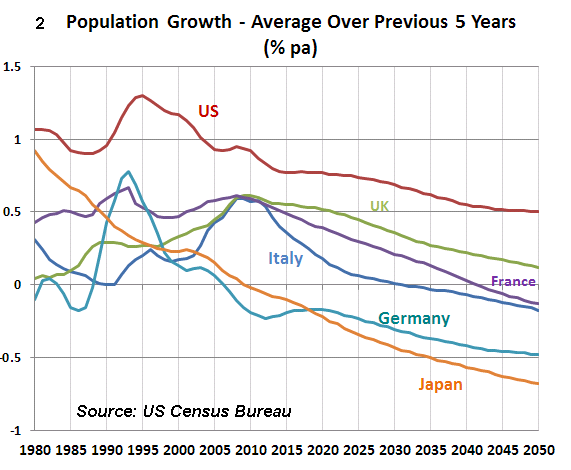
First, we see a significant slowdown in population growth in G7 countries (6).
We get a similar story by looking at the change in working-age populations (7). In Japan, not only has its overall population shrunk for the third consecutive year, but its fertility rate is the fourth lowest in the OECD, its birth rate is one of the lowest in the world, and its proportion of people over age 65 has reached a global record (8).
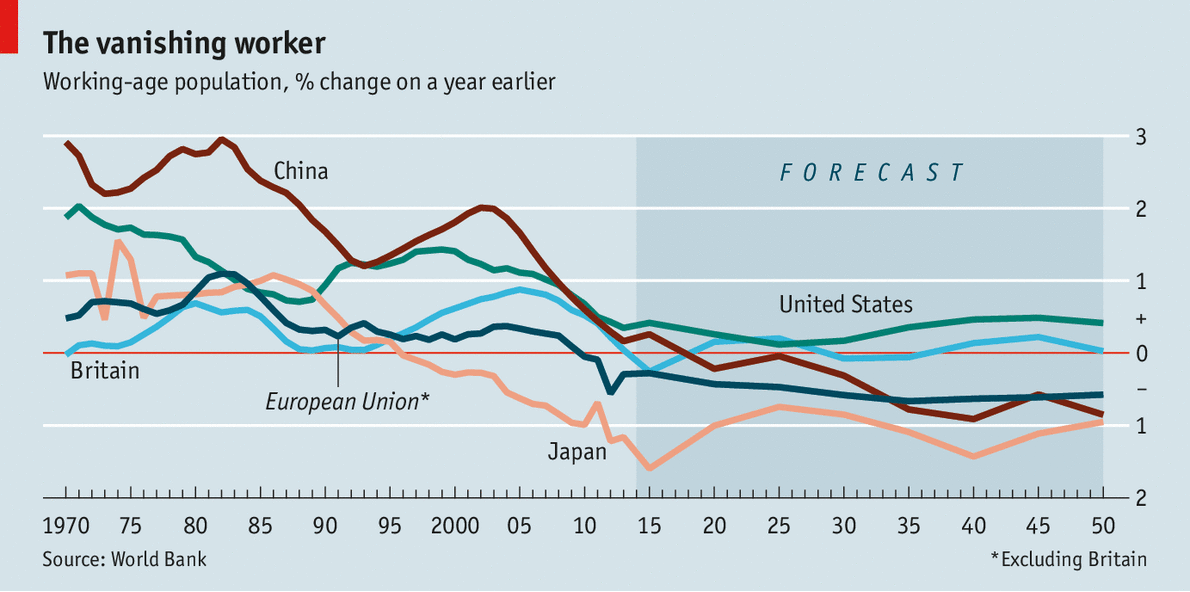
Per World Bank estimates, this trend will likely persist. The Samuelson consumption-loan model tells us why this is important (9). It postulates that the natural rate of interest is equal to population growth--so, a declining population growth means a declining natural rate of interest, and thus more investment needed to reach full employment. We could take a Krugmonian interpretation (10), and argue that a decline in population growth leads to a proportional decline in the natural rate, as Lawrence Summers has postulated that the natural rate is in fact negative. Put simply, less people working means less people consuming and thus less investment by businesses, lest they be left with a glut. Provided that sluggish population growth persists or even magnifies, this will be permanent.
Next, let's consider the substantial downward revision in potential GDP--or the output economies could generate at benchmark levels of resource utilization deemed sustainable (11). A significant downward trend in long-run GDP growth estimates is discussed by Drechsel et al., 2012, (12).
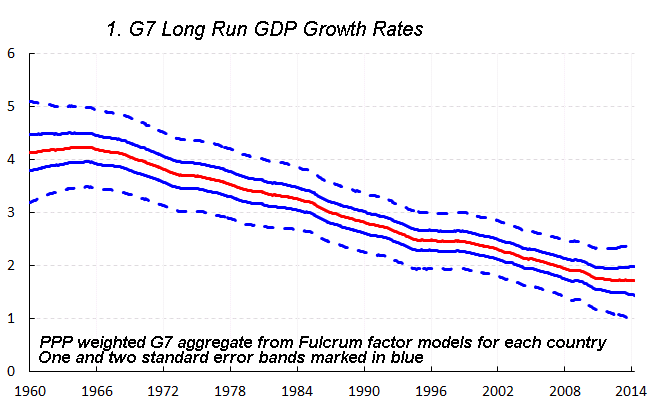
We see persistent downward trend from the 1970s on. But there's an interesting case in the US: In February 2014, the Congressional Budget Office revised downward potential GDP for the US by 7.3 percent (13).
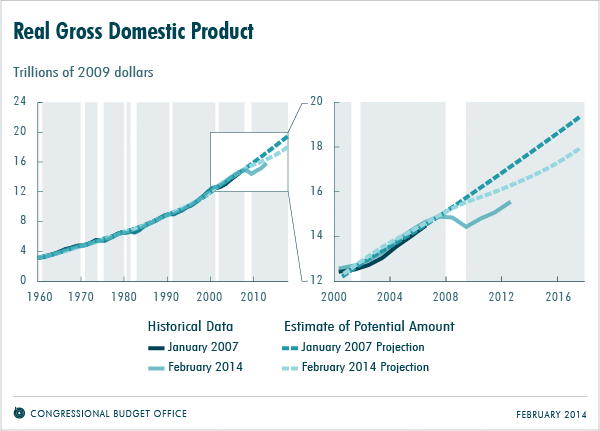
As Lawrence Summers argues, "it must be acknowledged that essentially all of the convergence between the economy’s level of output and its potential has been achieved not through the economy’s growth, but through downward revisions in its potential...the economy is now 10 percent below what in 2007 we thought its potential would be in 2014. Of that 10 percent gap, 5 percent has already been accommodated into a reduction in the estimate of its potential, and 5 percent remains as an estimate of its GDP gap. In other words, through this recovery, we have made no progress in restoring GDP to its potential" (14).
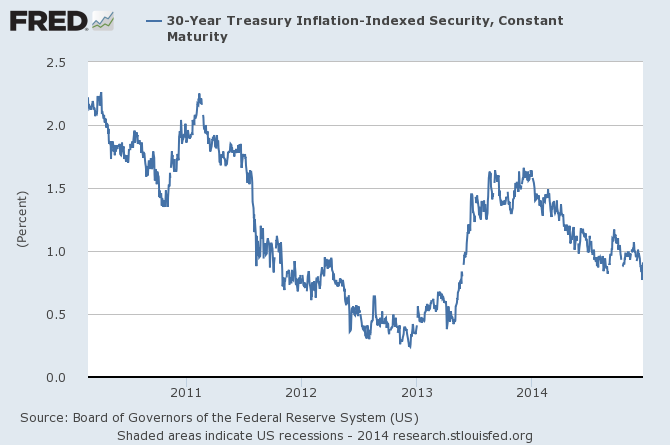
Moreover, even the FOMC in their recent Summary of Economic Projections predicts that real GDP will grow only 2 to 2.3 percent over the "long run" relative to the 3 percent long-run average (15). We can even see that markets are forecasting sluggish growth moving forward, bidding down the 30 TIPS yield--or the (real) rate at which participants will lend to the government over a 30-year period (16)--to only 91 basis points.
A similar story can be seen by looking at market-based measures of inflation expectations, such as the 10-year TIPS spread, which has been falling dramatically and is now at 1.65 percent (17).
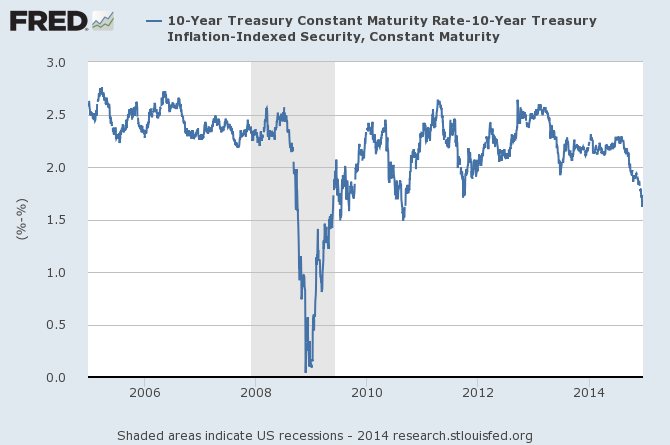
The takeaway from this is that even market participants are expecting, over the long run, slow growth and low inflation--and these expectations are obviously self-reinforcing. Obviously if you expect low inflation, you save more, which applies downward pressure on Treasury yields.
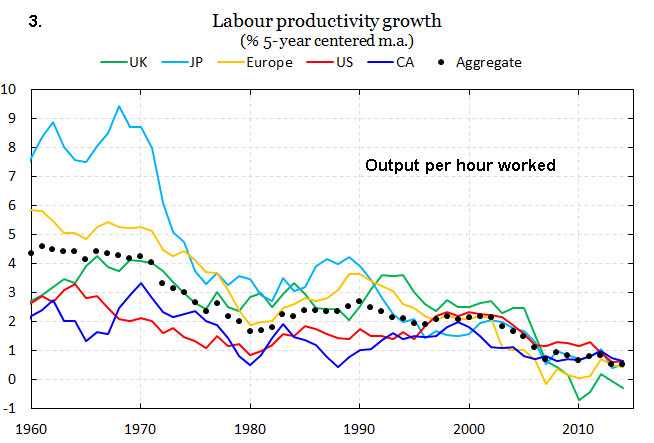
There's more to the story, though. Martin et al., 2014, from the Board of Governors conducted an analysis of 23 advanced economies through 149 recessions, and found that recessions--particularly prolonged ones, such as the Great Recession of 2007-09--deal permanent damage to potential output (18). Even following shorter recessions, real GDP remains well below pre-recession trends. Much of this is due to hysteresis, or atrophying of worker skills over time, which leads many to be considered unemployable, subjecting them to discrimination by employers--evidence for this form of negative duration dependence is discussed by Kroft et al, 2012, (19) as well as Hornstein et al., 2011 (20). In other words, cyclical problems turn structural, so not even the entirety of the working-age population is considered employable--so that translates into lower productivity and less consumption and investment, and thus lower trend RGDP. This would in fact exacerbate the significant slowing in productivity growth we've seen in G7 countries (6). "G7 productivity growth fell from about 4 per cent to about 2.5 per cent per annum during the 1970s, and then seems to have fallen to about 1 percent in the early 2000s, before the financial crash. A slowdown in technical progress is the reason usually given for this progressive deceleration in productivity growth" (6).
And, though the labor force participation rate in the US has declined substantially, from 66 percent pre-recession to 62.8 percent now (21), much of this is structural in nature. Goldman Sachs conducted a review of the relevant literature--14 studies--and found that the median median suggests that 1.6 percentage points of the decline was structural (22). For instance, a recent paper from the Board of Governors from Aaronson et al., 2014, found that as much as three fourths of this decline is structural(23). The takeaway is that failure to act aggressively--such as, for instance, public investment in job training programs--will exacerbate this problem.
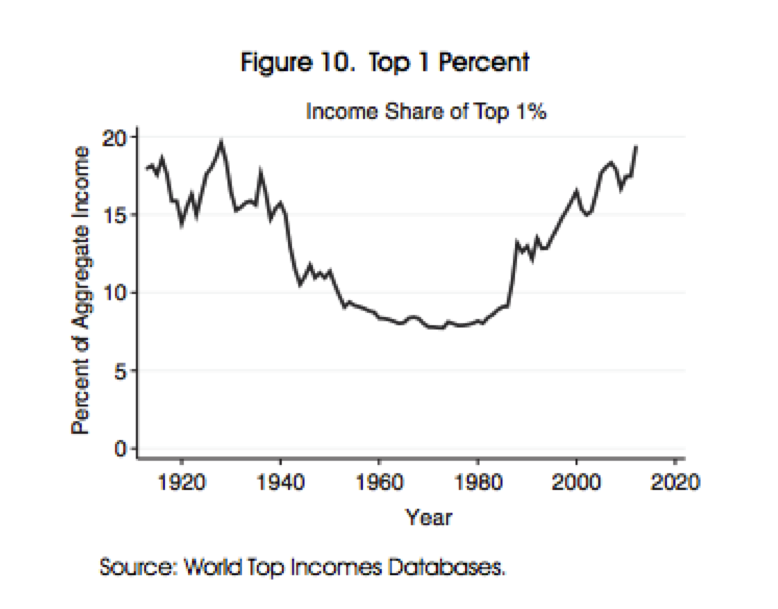
Finally, let's discuss income inequality with a focus on the US, where income inequality is worse now than it's been since 1928 (24) (14).
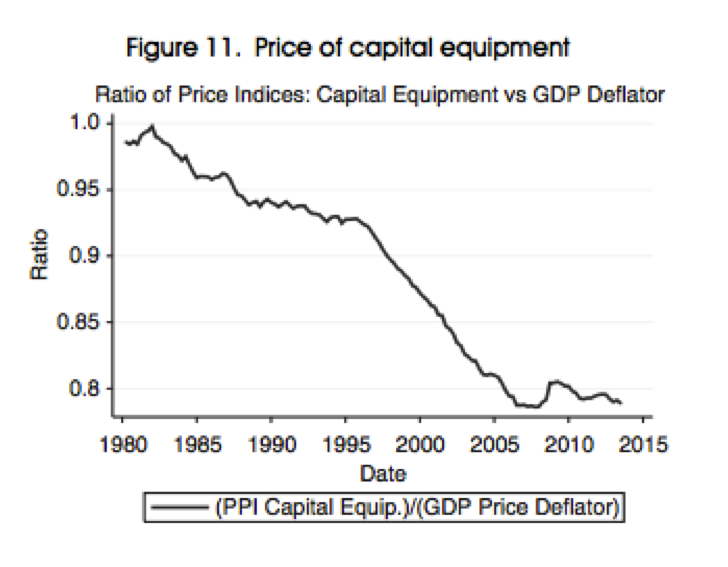
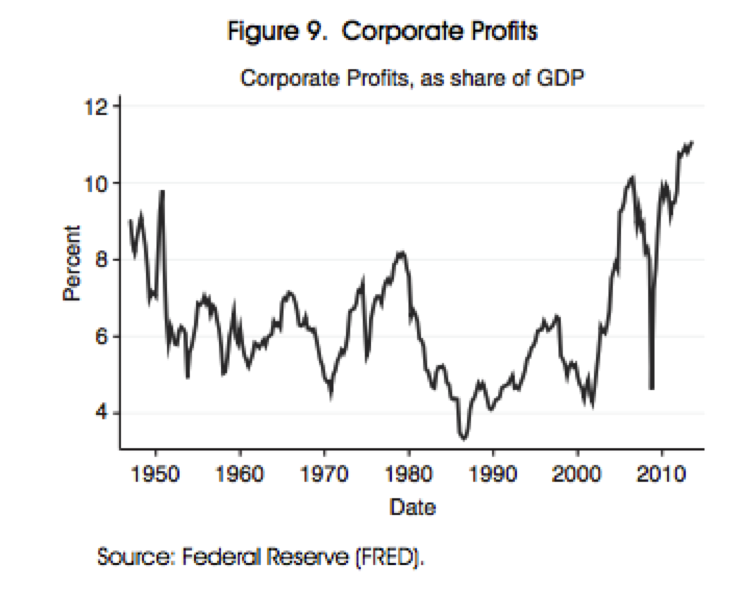
This is compounded by a falling cost of capital equipment--reducing required investment and increasing corporate retained earnings--and by the significant rise in corporate profits to all-time highs (14)(25), as the following graphs show (14).
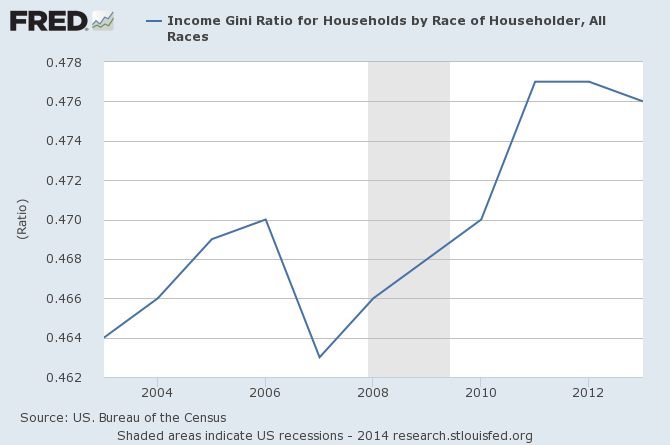
For a gauge of inequality, let's look at the Gini Coefficient, which has increased since the recession--note that a 0 is "perfect inequality" and a 1 is perfect inequality. The U.S. currently is at .476. (26).
Now, why should we care? Because, per Christopher Caroll, the marginal propensity to consume for lower-income households is far greater than for higher-income households (27). So, as the income distribution is skewed in the favor of higher-income individuals who are more likely to save than to spend, the result is a persistent shortfall in demand.
Because these factors are going to persist, and will persist largely due to the the continued malaise resulting from the Great Recession, it is urgent that we address this with a permanent solution rather than a band-aid. Monetary expansion cannot last forever; not only is current monetary policy insufficient to achieve full employment, meaning that it would need to be even more expansionary--costing central-bank credibility and anchored expectations, and leading to market volatility--but it has the potential to spur financial imbalances, as underpriced risk leads investors to "reach for yield," which could effectively bring on yet another Great Recession. Moreover, even a doubling of the monetary base in Japan and nearly tripling it in the US hasn't done much to raise inflation and return employment to desirable levels (28). The solution is for the federal government to raise taxes on the truly affluent and fund job training programs to ameliorate hysteresis amongst the long-term unemployed; single-payer to account for the persistently rising costs of healthcare, which would in fact save money over the longer run because Medicare has significantly lower operating costs than private insurance (29); education and research to ameliorate sluggish productivity growth and the high cost of college, as well as the possibility of a skills mismatch shown by a persistent shift the Beveridge Curve which has yet to fully revert back to pre-recession levels, as shown by Hobijn and Sahin, 2012 (30); infrastructure, which is crumbling (31); and more. Only then can we generate the necessary demand at a relatively higher natural rate of interest consistent with financial stability.
With the remaining space I have, I'll offer a few more contentions.
Contention Two: Income and Wealth Inequality
Nobel Laureate Joseph Stiglitz makes a compelling case against income inequality: the middle class is unable to consume in order to sustain full employment, opportunities for advancement and education are hindered, tax receipts are hindered, and boom-and-bust cycles and speculative activity becomes much more frequent.
“There are four major reasons inequality is squelching our recovery. The most immediate is that our middle class is too weak to support the consumer spending that has historically driven our economic growth...Second, the hollowing out of the middle class since the 1970s, a phenomenon interrupted only briefly in the 1990s, means that they are unable to invest in their future, by educating themselves and their children and by starting or improving businesses...Third, the weakness of the middle class is holding back tax receipts, especially because those at the top are so adroit in avoiding taxes and in getting Washington to give them tax breaks...Fourth, inequality is associated with more frequent and more severe boom-and-bust cycles that make our economy more volatile and vulnerable. Though inequality did not directly cause the crisis, it is no coincidence that the 1920s — the last time inequality of income and wealth in the United States was so high — ended with the Great Crash and the Depression...[...]” (32).
Thomas Pikkety, in his best-sellingCapital in the Twenty-First Century, approaches ths from a slightly different standpoint: he argues that the rate of return on capital, which is more likely to be held by the affluent than the middle- or lower- classes, will exceed income growth: in other words, economic growth grows, let’s say, 1 or 2 percent, meaning that annual incomes grow only 1 or 2 percent, while the more affluent earn a 5 percent return on capital. This is compounded with the fact that the distribution of wealth is more concentrated than the distribution of income, so both income and wealth inequality increase.
“When the rate of return on capital exceeds the rate of growth of output and income, as it did in the nineteenth century and seems quite likely to do again in the twenty-first, capitalism automatically generates arbitrary and unsustainable inequalities that radically undermine the meritocratic values on which democratic societies are based” (33) (34).
Contention Three: Tax hikes are not harmful, on net, to the U.S. economy
A myriad of work suggests that tax hikes of the kind I propose would not hinder economic growth.
Hungerford, 2012: "The results of the analysis in this report suggest that changes over the past 65 years in the top marginal tax rate and the top capital gains tax rate do not appear correlated with economic growth. The reduction in the top statutory tax rates appears to be uncorrelated with saving, investment, and productivity growth...However, the top tax rate reductions appear to be associated with the increasing concentration of income at the top of the income distribution" (35).
Krueger and Kindermann, 2014: "[W]e have numerically characterized the optimal marginal earnings tax rate (τh) faced by the top 1% of the cross-sectional earnings distribution. We found it to be very high, in the order of 90%, fairly independently of whether the top 1% is included or excluded in the social welfare function, and independently of whether transitional or long run welfare is considered (36).
Fieldhouse, 2013: "Analysis of top tax rate changes since World War II show that higher rates have no statistically significant impact on factors driving economic growth"private saving, investment levels, labor participation rates, and labor productivity"nor on overall economic growth rates...Recent research implies a revenue-maximizing top effective federal income tax rate of roughly 68.7 percent...This would mean a top statutory income tax rate of 66.1 percent, 26.5 percentage points above the prevailing 39.6 percent top statutory rate" (37).
Diamond and Saez, 2011: "[T]he optimal top tax rate using the current taxable income base..would be `4;* = 1/(1 1.5. " 0.57). = 54 percent, while the optimal tax rate using a broader income base with no deductions would be `4; * = 1/(1 1.5. " 0.17). = 80 percent. Taking as fixed state and payroll tax rates, such rates correspond to top federal income tax rates equal to 48 percent and 76 percent, respectively" (38).
Contention Four: Paradox of Toil
This an argument primarily made by Gauti Eggertsson, 2009 and 2010, from the New York Fed (39) (40). In simplest terms, here is the argument.
The real rate of interest, which is equal to the nominal rate minus the rate of inflation, is what bears on investment--in other words, when real rates rise, investment and consumption fall, and vice versa. So, when the Fed wants to stimulate demand, it cuts interest rates. Note that this case is only truly applicable at zero nominal interest rates, but seeing as the U.S., Japan, the U.K., and the ECB are currently dealing with episodes of the zero lower bound, this case is perfectly applicable, especially because John Williams, 2014, argues that the so-called “tail risk” of an economy being pinned at zero nominal rates is likely to persist into the future (41)--and this is especially true in light of my earlier arguments on secular stagnation, which will result in a necessity of interest rates which are lower for a longer period of time. Note that low interest rates do not necessarily reflect expansionary monetary policy, but could reflect low incomes and low
Tax cuts tend to shift the aggregate supply curve to the right which makes people want to work more--meaning that the labor supply, also, shifts to the right. But, as the labor supply curve shifts out, this applies downward pressure on nominal wages--particularly in newly originated contracts--and inflation expectations. In other words, we expect wages to fall and inflation to fall.
But as inflation--and particularly inflation expectations, which determine consumption levels and investment decisions--falls, the real rate of interest, per our earlier equation, rises. As the real rate of interest rises, consumption and investment fall, meaning that aggregate demand falls, meaning that inflation falls, meaning that real rates rise again, ad infinitum.
In other words, these types of tax cuts are inherently contractionary and destabilizing--meaning that, instead of trying to shift the aggregate supply curve out, we should try to shift the aggregate demand curve out, which is precisely what my proposal does.
Contention Five: Evidence of post-crisis expansionary policy
There’s effectively an open and shut case with respect to responses to the 2007-09 recession. Both the U.S. and the U.K. were significantly more expansionary with both monetary and fiscal policy than Europe and Japan, and achieved significantly better results. We can see this in the following graph (42).
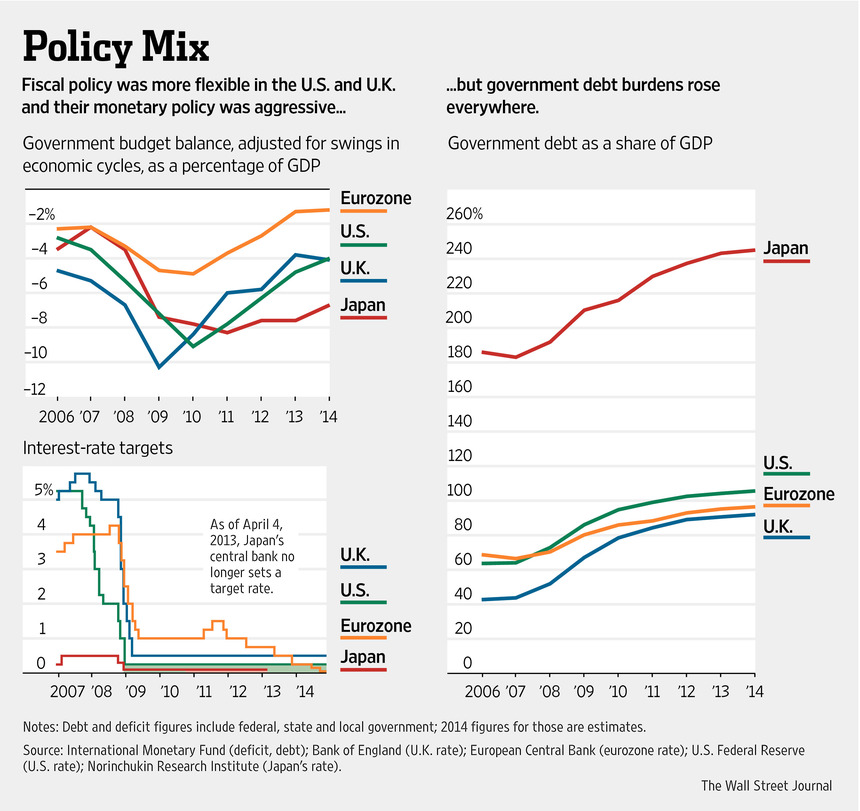
The point is, following the worst financial crisis since the Great Depression, there was a clear need for expansionary policy to account for the shortfall in aggregate demand--had we not done that, instead of 2 to 2.3 percent long-run growth, we’d probably be looking at an even worse trend rate of growth. We know that expansionary policy can work and has work, and there is still work to be done--we must be willing to retain aggressive policy measures into the future, and the only way to do so is with a permanent fiscal expansion funded by higher tax rates on the affluent.
References
(1) http://tinyurl.com/2c7vdkd
(2) http://tinyurl.com/mu8bg87
(3) http://tinyurl.com/l6oxjyv
(4)http://tinyurl.com/mdeqecy
(5) http://tinyurl.com/ydcw25r
(6) http://tinyurl.com/qjx4a92
(7) http://tinyurl.com/pnelkjw
(8) http://tinyurl.com/knl2ycn
(9) http://tinyurl.com/qycx2uv
(10) http://tinyurl.com/kcf44kp
(11) http://tinyurl.com/klb4c2w
(12) http://tinyurl.com/kc2exe8
(13) http://tinyurl.com/p4v3kro
(14) http://tinyurl.com/pyzw9e3
(15) http://tinyurl.com/njm7fuz
(16) http://tinyurl.com/npx7a4y
(17) http://tinyurl.com/kulurv7
(18) http://tinyurl.com/p68y4l5
(19) http://tinyurl.com/otsme3e
(20) http://tinyurl.com/qbrqv76
(21) http://tinyurl.com/m4ua3v2
(22) http://tinyurl.com/lsawknw
(23) http://tinyurl.com/ldgacux
(24) http://tinyurl.com/kb7ly4k
(25) http://tinyurl.com/p9ay993
(26)http://tinyurl.com/mojbjrc
(27) http://tinyurl.com/ovvl67c
(28) http://tinyurl.com/kkw7nbl
(29) http://tinyurl.com/o8g662
(30) http://tinyurl.com/nv2eb6f
(31) http://tinyurl.com/nwdlc3o
(32 )http://tinyurl.com/aqxj9ro
(33) http://tinyurl.com/n3md5oo
(34) Capital in the Twenty-First Century by Thomas Piketty
(35) http://tinyurl.com/p6d6jsh
(36) http://tinyurl.com/qy52ync
(37) http://tinyurl.com/knnnqt2
(38) http://tinyurl.com/mwrf6yv
(39)http://tinyurl.com/qd5k93q
(40) http://tinyurl.com/nqvxgpd
(41) http://tinyurl.com/ock2d6p
(42) http://tinyurl.com/pusfdtq
Return To Top | Posted:
MikeMighty (PRO)rich is many many money like bill gates like millionaires for rich people it's ok to have taxes there money is like no limit.
Return To Top | Posted:
JohnMaynardKeynes (CON)I'm quite baffled and unsure as to what I should think right now, because Pro requested to debate me, and agreed to this resolution, as well as the time periods per round and the stipulations. However, he does not appear to have taken any time to write out a case or to engage my case in the slightest--he doesn't even seem to acknowledge that my case was there. I'm not in the business of calling anyone a troll, nor do I want this to come across as an attack on my adversary, but I am left without any clue as to how I should react at this point. Even the arguments Pro does raise hasn't the slightest bit of relevance to his side of this debate, either. Nevertheless, I'll briefly address them.
Return To Top | Posted:
 Judge: Unbelievable.Time
 Judge: Pinkie
 Judge: admin
 Judge: nzlockie
 Judge: Wylted